Categories
Climate

Medieval Warm Period local or global?

Global warming is directly influencing humans through surface temperatures, but most heat uptake occurs in the ocean. It is therefore interesting how the ocean heat content has changed over time. In a recent article in Science Rosenthal et al. present a temperature record of western equatorial Pacific subsurface and intermediate water masses over the past 10,000 years that shows that heat content varied in step with both northern and southern high-latitude oceans. The findings support the view that the Holocene Thermal Maximum, the Medieval Warm Period, and the Little Ice Age were global events, and they provide a long-term perspective for evaluating the role of ocean heat content in various warming scenarios for the future. This result conflicts with the one of Pages 2k consortium in Nature Geoscience earlier this year where they state: “There were no globally synchronous multi-decadal warm or cold intervals that define a worldwide Medieval Warm Period or Little Ice Age”.

Categories
Climate malaria vector-borne diseases

Inherited selection bias, climate models, and vector borne diseases

Empirical cumulative distribution function of warming per year [C] for 1984-2013 (left) and 1997-2013 (right). The distribution function was estimated using 38 CMIP5 models with a total of 344 simulations. The grey dot shows the actual warming rate (based on HadCRUT.4.2) which is lower than 95% of the climate model realisations for the 30 year period (1984-2013), and lower than 99% of the climate model realisations for the 15 year period (1997-2013). 1961-1990 was used as the baseline period.
This week I am discussing the “pause” in global warming, if the IPCC near term surface temperature projections might be too high, and how such errors influence projected changes in vector borne diseases. The full post can be read at Biomedcentral´s Bugbitten blog.


Categories
Climate

It is normal models heat and cool the planet too fast/slow

In the discussion about the rate the planet is warming it is tempting to pick single years, and say the models are not correct, you blotted your copybook, the planet is not heating as fast as models predicted, and it will probably not become as warm as the models say. At the moment, we have 20 year period where the median warming rate of 36 CMIP5 models is about 0.15 degrees Kelvin/decade higher than observed. Figure 1 is showing the real and modelled  warming rate from 1870-2013, and the modelled up to 2300 using three of the RCP scenarios. It is evident the observed warming rate the last 20 years does not match the modelled ones.

Figure 1
Figure 1

So what do we expect? We do not expect the difference in warming rate to be zero all the time, but we expect that at some points in time the models will warm/cool the planet too fast, and sometimes too slow. Figure 2 shows the distribution of the difference in warming rate (CMIP5[median] – HadCRUT4), and a Shapiro-Wilk test of normality suggest we can not reject the data is not normally distributed. The figure shows that sometimes the models will warm/cool the planet too fast, and sometimes they will warm/cool it too slow, and “it is normal”. Anyway, the main message from the models should be clear; no cooling in sight. I also recommend reading this post about warming rates.

Figure 2
Figure 2 Density of  CMIP5 median minus HadCRUT4; mean = 0.006 (95% CI -0.007, 0.019)
Categories
Climate

Climate and cherries

In a recent blog post at Climate Lab Book a recent press release by the World Meteorological Organisation (WMO) describing recent global temperature changes were discussed. Ed Hawkins makes a point about the definitions of a decade (from 2001-2010, 2000-2009, etc.) alters the conclusion of the report. He finds the largest change in temperature between decades is not to the most recent decade as claimed by WMO, but from 1987-1996 to the average of 1997-2006, at +0.24K.

The definition of a decade is cultural, and the result of such analysis clearly is dependent. To explore his ideas further, we define a decade as having 85 different starting and ending points, but all covering a period of 120 months. This means the last decade can be defined as 1996.05.16-2006.05.16, 1996.06.16-2006.06.16, …, 2003.05.16-2013.05.16. This will give us a distribution for each decade and hence limiting the issue of decade definition.

Figure 1: Warming rate per decade

warmingDecadeFig1Edit


Figure 1 shows the warming rate between two decades, and it is evident the warming rate was greatest between 1990-2000 and 2000-2010. It is also evident the WMO statement “The decadal rate of increase in the global temperature accelerated between 1971 and 2010” is correct, but the picture is different if we expand the period to 1961 to 2010. The greatest change in warming rate happened from approximately the period (1970-1980/1960-1970) to (1980-1990/1970-1980), so I think we still see some cherry picking, with WMO and Climate Lab Book liking different cherries. Still, no doubt it is becoming warmer…

Categories
malaria publishing

Do publisheres read articles before tweeting about them?

BioMed Central wrote this tweet twice twice the last days. They state: “Success story! Malaria burden decreases … after interventions”. Nothing wrong about the last part of the statement. In the article they see a decline in malaria cases after interventions were scaled up, but is it enough to call it a success story? I would love to see evidence malaria declining with or without interventions, and good documentation interventions are working; and I love to see the authors presenting historical data on malaria incidence, but in this case I think BioMed Central forgot it is not a newspaper, but a publisher of scientific articles.

Lets look at the figure behind the “success story”:

MalariaZimbabwe

What we see is a steady increase from 2003-2008; with IRS, and CQ+SP. After RDTs, ACT and ITNs were introduced we see a steady decline, noting that data from 2011 are not complete. Based on these data I find it hard to claim this is a success story. If we are to believe the data, the number of malaria cases is still higher than 2003-2005, and there are no evidences the recent decline was due to interventions. In my eyes, it could be due to interventions, but as likely is natural variability. The article does not test any hypothesis, and does not prove interventions caused a reduction in malaria cases, but despite this, BioMed Central calls it a “success story”. It seems like BioMed Central might have problems knowing if it is a newspaper wanting to make headlines, or a scientific publisher making evidence based statements. Malaria Journal’s coverage of the same article

makes a lot more sense, describing the article in a way which reflects the content. I hope this is a one time mistake from @BioMedCentral.


Categories
malaria vector-borne diseases

Bednets can be used many ways

Last week we started our work in Adami Tullu, Ethiopia. We started collecting mosquitoes, a work which involves walking around in the villages. Over the last year, bednets have been distributed, and most households should own at least one net (and maybe they do). We were able to see some of the nets; used as they should be used, as curtains, in fences, protecting trees and bushes, and used to store food and grass. We were also told by the people, rats taking parts of the nets to build nests is a big problem. Below are some pictures of alternative bednet use.

Bednets used to keep bugs or cattle away from trees
2013-06-20-347
Bednets are perfect for storing grass. Here in a tree.


2013-06-22-368
Is the net used to keep bugs away from the chilli, or just stored in a convenient place?


Categories
publishing

PeerJ one year old

Today, June 12 2013, PeerJ claims to be one year old. I guess, in one way it is, but I would claim it is 4 months old. Just to ruin the birthday party. I have three children, and I do not celebrate their birthday on the day I made it official that we where going to have a child, but the day I first saw them. Anyway, lets pretend PeerJ is one year old, and celebrate.

When I first heard about PeerJ, I thought it was a brilliant idea; spend money on research, not publisher’s profit; make reviews open; fast publication; do not select articles based on expected impact, but quality; and make articles available to everyone. And they managed to do it: a life time membership costs $99 (one article a year); 40% of reviewers now providing their name and almost 80% of authors making their reviews public; median time for final decision (accepted articles) is 49 days; and for the last two, look at the first 87 articles, and judge for yourself.

My favourite article so far is “Significant changes in the skin microbiome mediated by the sport of roller derby“, simply because the research, setting, and methods are fun. I really hope more people will embrace PeerJ, and their thinking about open research, data, and publishing costs. Personally I think the Lancet, Nature, …, look like old grumpy men now, claiming the Earth is flat.

And the best of all; today you can win a monkey fridge magnet. All you have to do is typing:

“PeerJ just turned one (or four months, really)! Open access publishing, for just $99 for life – check them out and submit now!” 

Categories
Climate malaria vector-borne diseases

The common solution

In a recent article in GRL, Emerging selection bias in large-scale climate change simulations, Kyle L. Swanson describes how experiments might go wrong as we seek a desired solution. He hypothesise a common wish to reproduce the recent warming in the Arctic, has lead to less diversity among models with convergence towards some common solution.

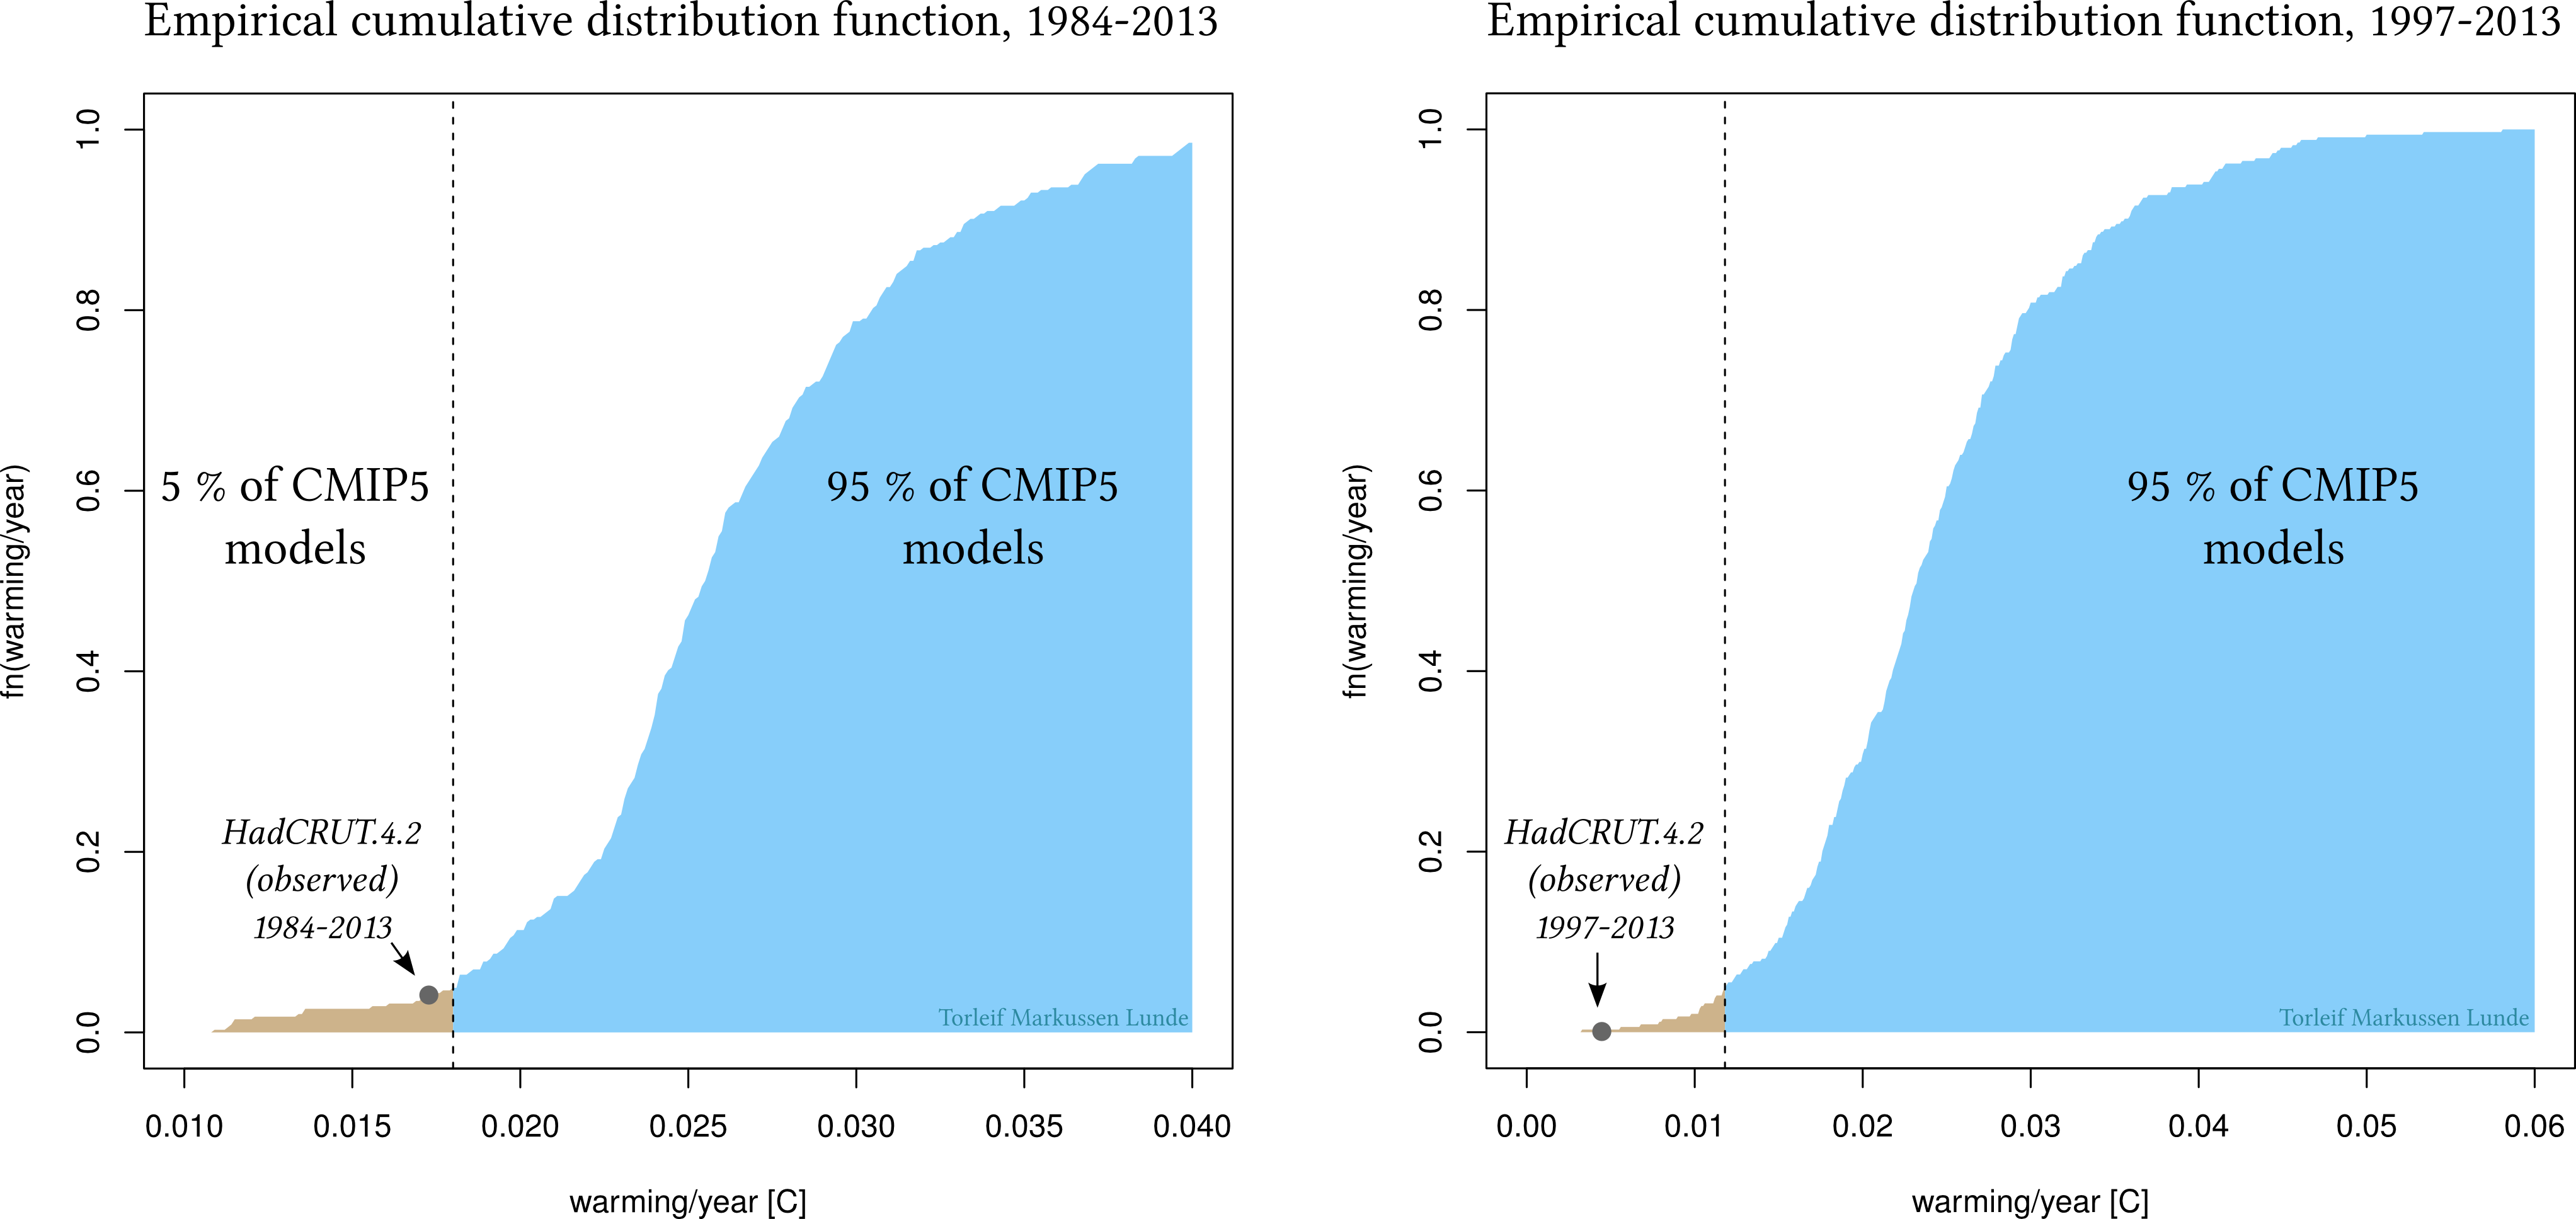
He writes the current generation ensembles of model simulations are statistically inconsistent with the observed shifts in in both the mean surface air temperature as well as the frequency of  extreme monthly mean temperature events due to climate warming, despite a marked reduction in the spread among ensemble members that by itself suggests convergence towards some common solution. This convergence indicates the possibility of a selection bias based upon warming rate.

I particularly liked his example of what happened after Robert A. Millikan’s original measurement of the charge of the electron: “Millikan’s original measurement was slightly erroneous due to the use of an incorrect value of the viscosity of air. In the decades following Millikan’s work and his subsequent Nobel Prize, other investigators empirically measured the electron charge. When they got a number that was too high above Millikan’s, they thought something must be wrong–and they would look for and find a reason why something might be wrong. When they got a number close to Millikan’s value they didn’t look so hard. And so they eliminated the numbers that were too far off, and did other things like that.”

In our paper in Malaria Journal, A dynamic model of some malaria-transmitting anopheline mosquitoes of the Afrotropical region. I. Model description and sensitivity analysis, we touch upon this issue by stating “A model is mental copy that describes one possible representation of a system… We present an alternative formulation of the dynamics of An. gambiae s.s. and An. arabiensis…  if malaria modelers move towards the ensemble thinking widely adopted in the climate community, this model could be one representation of historical and future changes for malaria. The aim of such an ensemble would be to deal with uncertainties in the system. Ultimately, the goal would be to produce policy-relevant information including uncertainty.”

The basic principles of climate are quite easy to understand; the sun is heating the Earth, with more radiation hitting the equator compared to the poles. Seasons are caused by the tilt of the Earth’s rotational axis away or toward the sun as it travels through its year-long path around the sun. From there you can add clouds, water, ice, land masses, aerosols, precipitation, and even mountain and building shadows if you are interested in local weather. The dynamics of malaria can be simplified in the same manner; an uninfected mosquito bites an infectious human, lives for about ten days, and from that time it can infect new humans every time it bites a human. From this simple model it has been demonstrated that killing mosquitoes is an efficient way of reducing malaria, but it is not able to tell us how efficient. To get a realistic representation of how emissions of greenhouse gasses influence climate, or how malaria is reduced by distributing bed nets we need more complex models together with observations. As we add more realism to the system, we also parameters with uncertainty, uncertainty which was there from the beginning, but which becomes visible as we describe them. If we intended to use an ensemble of models to estimate the effect of for example bed nets against malaria, we could get a very precise estimate if all models were identical, or measured their success by managing to keep malaria away from South Africa (many malaria models predict malaria is widespread there). There are still many things we do not know about malaria, and I hope modellers of malaria do not do the same mistake it seems like global climate models are moving towards; a common solution due to wrong reasons.

Categories
Climate malaria

Malaria in the UK and climate change

A couple of days ago I saw this tweet:

I agree with Tim France, but with the short tweet he also assumes UK will be a rich country with a good health system in 100 years. Below are some thoughts on how we evaluate the impacts of climate change, following up a previous post.

Every time driving a car, there is a chance you will crash. In thunderstorms you might be hit by lightning, and at any time your home could be hit by a meteor. If you drive faster the consequences of a car crash is probably more severe; if you fill your pockets with iron and stand under a tree in a thunderstorm that might be a bad idea; we can increase or reduce the risk of something bad happening. For meteors, well, there is currently not much we can do. What all of these threats have in common is the low probability they will occur, but if they do the result might be devastating.

How are these risks related to malaria in the UK and climate change? The answer is probability. Malaria was common in the in Northern Europe including UK, Sweden and Finland 250-100 years ago, but is no longer a problem. While temperatures declined or showed no trend from about 1750 to the 1920s they have risen since, and we have seen no resurgence of malaria in Europe (except from small outbreaks).

Let us go back to the car. The risk, or probability, of serious injuries in a car crash is dependent on many factors. Increasing the speed will increase the risk, but how do we compare driving a car at 40 MPH without a seat belt to driving the a car at 50 MPH with a seatbelt? From 1750 to 2013 Europe got seat belts and air bags preventing malaria; better houses (less mosquito contact), improved health systems (shorter time to recovery), the population density increased (less mosquitoes per human), and land use changed (less breeding sites for mosquitoes). These factors allowed us to increase the air temperature without increasing the risk of malaria epidemics. So what about the future?

It is virtually certain temperatures will continue to increase the next 100 years. The temperature increase alone will potentially lead to more malaria. But the real impact? Do we assume UK has the same health system in 2100 as today? Will people live in even better houses? What if there is a war in 2080? The IPCC does not make assumptions or scenarios describing alternative realities (on national scales) on how societies will develop the next 100 years. To understand the possible real, and not only theoretical, impacts of climate change, we must also dare to speculate about how society will evolve over the next 100 years. Only then we can come closer to understanding the risk of increasing the speed from 40 to 50 MPH, and know under which assumptions we are making projections about impacts of climate change.


Categories
Climate malaria

Temperature effects on the development rate and survival of two malaria vectors, and consequences for transmission

Yesterday an article by Lyons et al., “Stable and fluctuating temperature effects on the development rate and survival of two malaria vectors, Anopheles arabiensis and Anopheles funestus“, was published in Parasites & Vectors. This study is important to understand how climate change, changes in temperature between seasons, and from year-to-year influence the transmission of malaria. In this context it is interesting to see if the new data on Anopheles arabiensis alters the conclusion at which malaria is most efficiently transmitted. We refitted the egg-to-adult survival probability and mosquito development rate models described by Mordecai et al. with the data from the paper by Lyons et al., and calculated R0 according to temperature. While the old estimates for Anopheles gambiae s.s. suggested malaria is most efficiently transmitted at 25.6 C, the new data suggest malaria is most efficiently transmitted (by Anopheles arabiensis) at 25.7 C. The plot is showing transmission potential at the y-axis, and temperature in C at the x-axis. The red line is the estimate by Mordecai et al., while the black line is the estimate with the new data on Anopheles arabiensis.


r0newEstimate