Categories
Climate

It is normal models heat and cool the planet too fast/slow

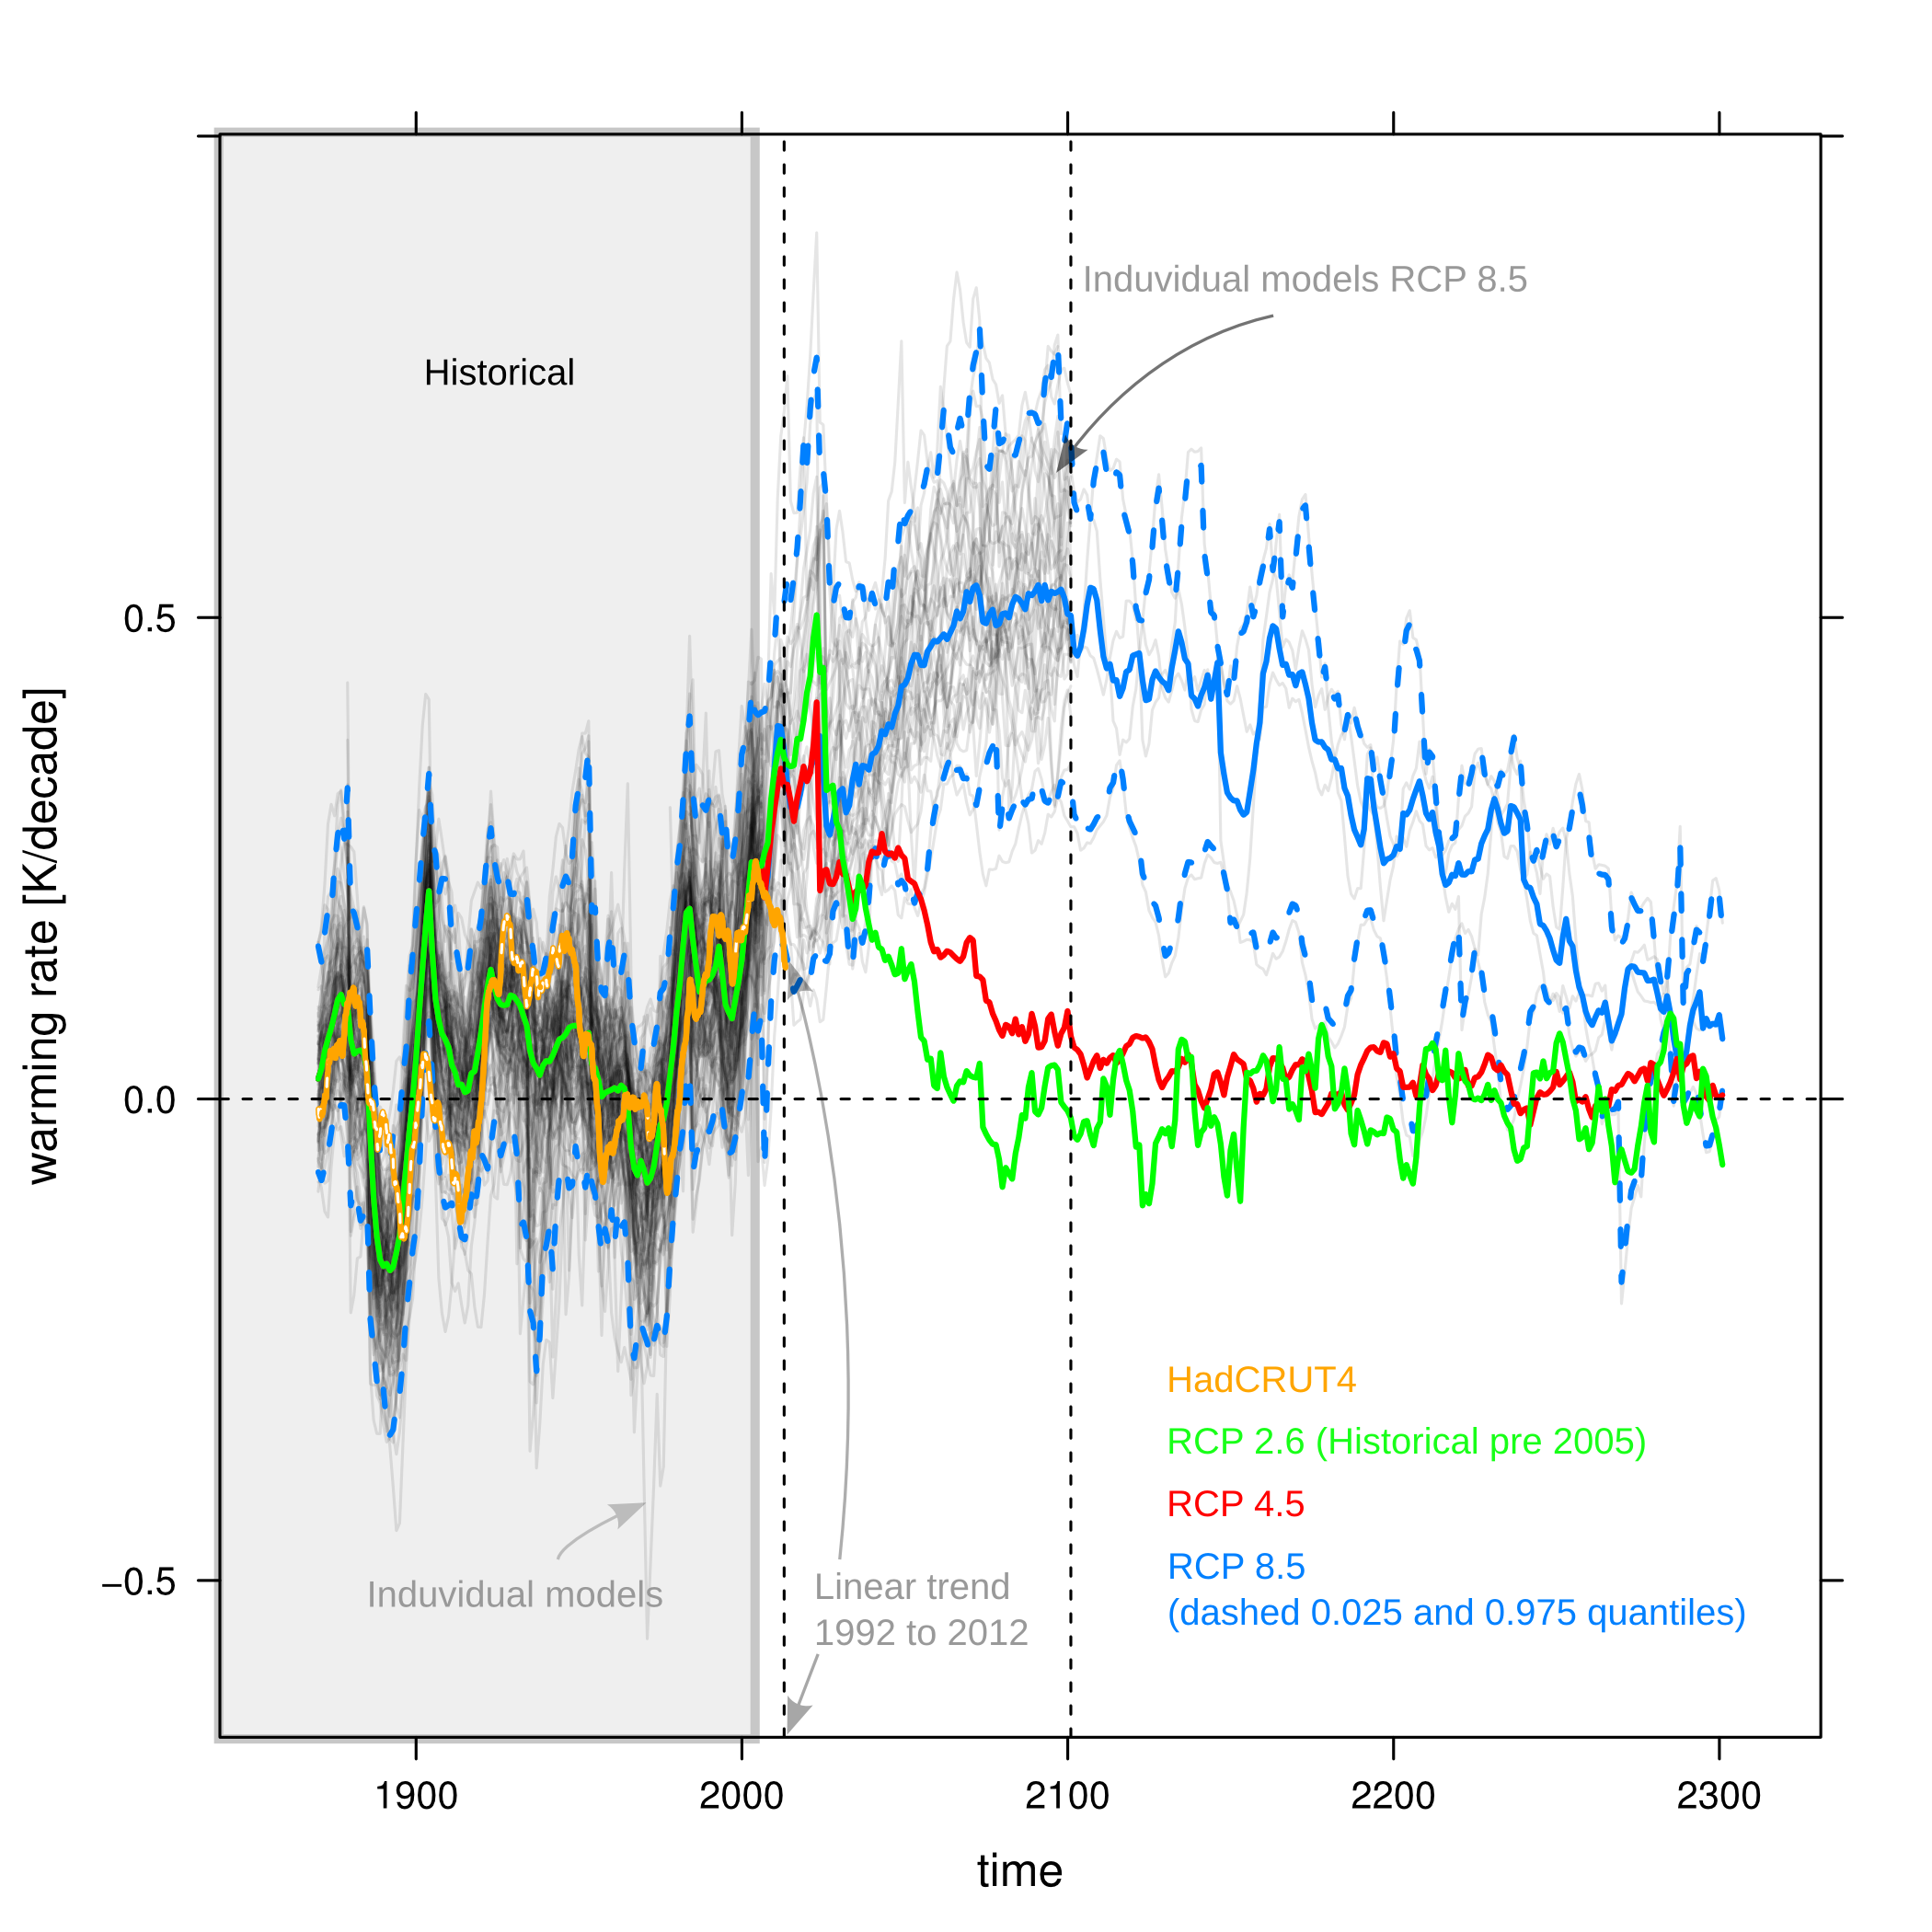
In the discussion about the rate the planet is warming it is tempting to pick single years, and say the models are not correct, you blotted your copybook, the planet is not heating as fast as models predicted, and it will probably not become as warm as the models say. At the moment, we have 20 year period where the median warming rate of 36 CMIP5 models is about 0.15 degrees Kelvin/decade higher than observed. Figure 1 is showing the real and modelled  warming rate from 1870-2013, and the modelled up to 2300 using three of the RCP scenarios. It is evident the observed warming rate the last 20 years does not match the modelled ones.

Figure 1
Figure 1

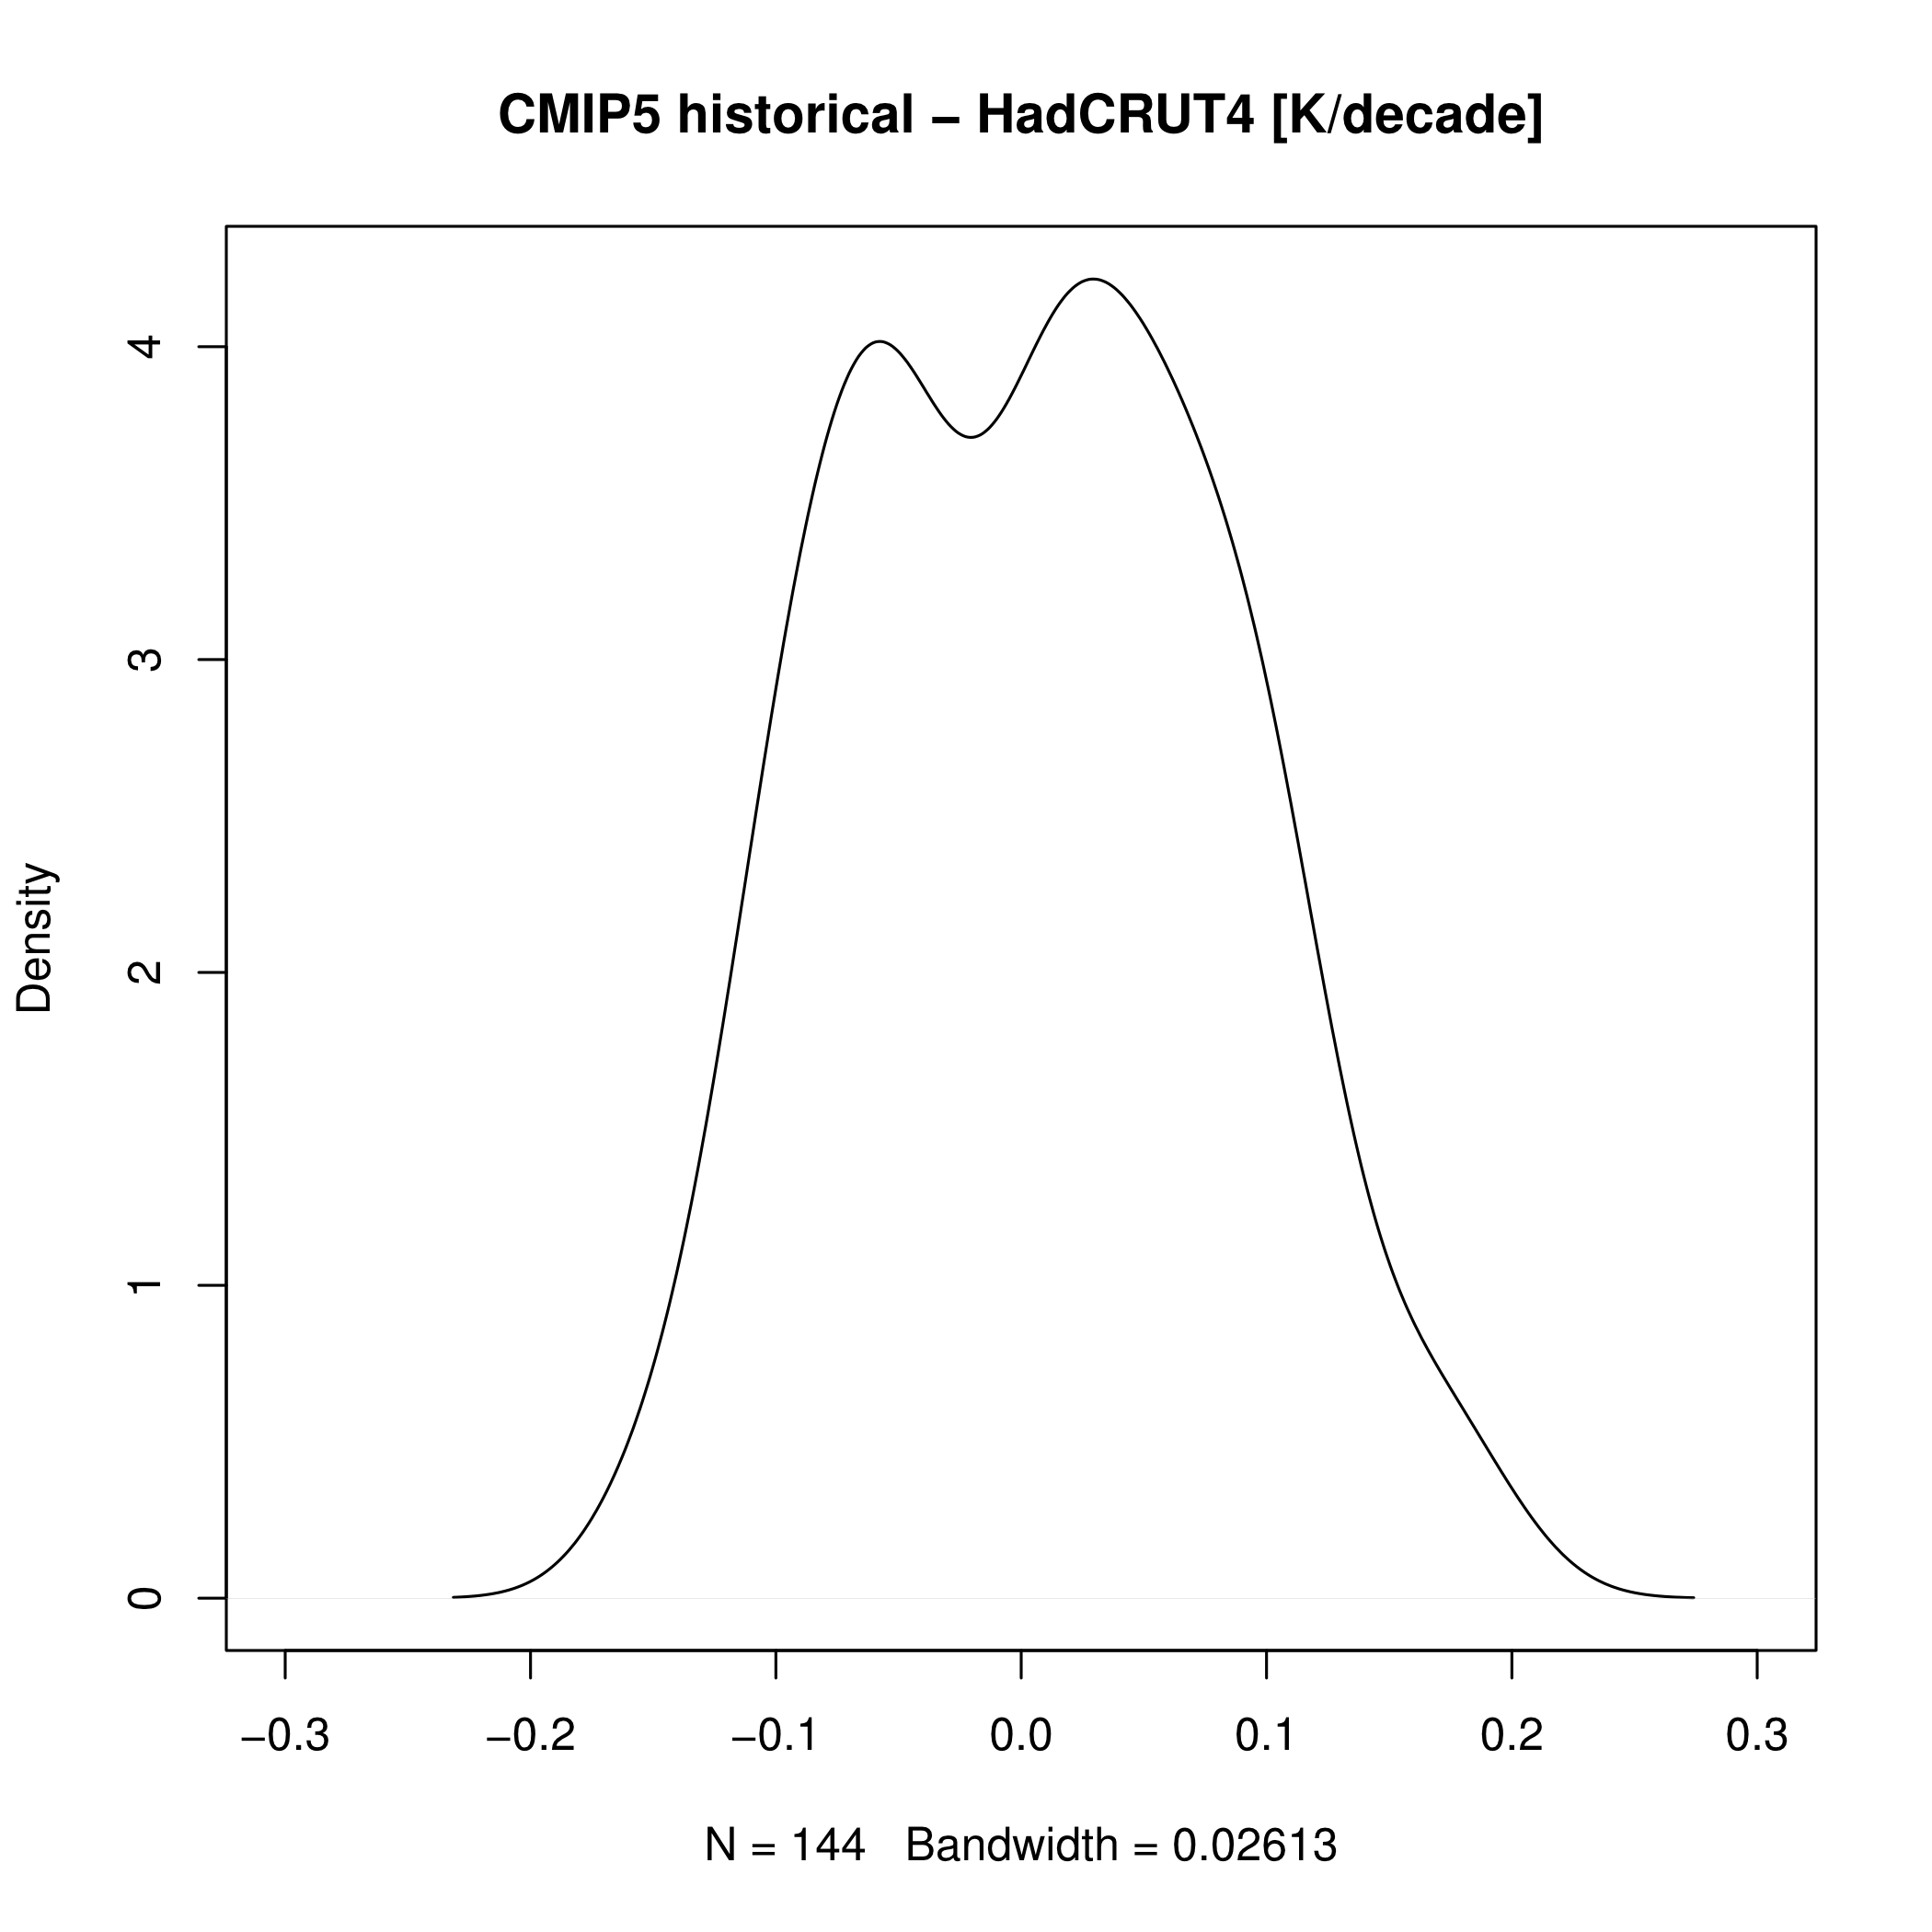
So what do we expect? We do not expect the difference in warming rate to be zero all the time, but we expect that at some points in time the models will warm/cool the planet too fast, and sometimes too slow. Figure 2 shows the distribution of the difference in warming rate (CMIP5[median] – HadCRUT4), and a Shapiro-Wilk test of normality suggest we can not reject the data is not normally distributed. The figure shows that sometimes the models will warm/cool the planet too fast, and sometimes they will warm/cool it too slow, and “it is normal”. Anyway, the main message from the models should be clear; no cooling in sight. I also recommend reading this post about warming rates.

Figure 2
Figure 2 Density of  CMIP5 median minus HadCRUT4; mean = 0.006 (95% CI -0.007, 0.019)
Categories
Climate

Climate and cherries

In a recent blog post at Climate Lab Book a recent press release by the World Meteorological Organisation (WMO) describing recent global temperature changes were discussed. Ed Hawkins makes a point about the definitions of a decade (from 2001-2010, 2000-2009, etc.) alters the conclusion of the report. He finds the largest change in temperature between decades is not to the most recent decade as claimed by WMO, but from 1987-1996 to the average of 1997-2006, at +0.24K.

The definition of a decade is cultural, and the result of such analysis clearly is dependent. To explore his ideas further, we define a decade as having 85 different starting and ending points, but all covering a period of 120 months. This means the last decade can be defined as 1996.05.16-2006.05.16, 1996.06.16-2006.06.16, …, 2003.05.16-2013.05.16. This will give us a distribution for each decade and hence limiting the issue of decade definition.

Figure 1: Warming rate per decade

warmingDecadeFig1Edit


Figure 1 shows the warming rate between two decades, and it is evident the warming rate was greatest between 1990-2000 and 2000-2010. It is also evident the WMO statement “The decadal rate of increase in the global temperature accelerated between 1971 and 2010” is correct, but the picture is different if we expand the period to 1961 to 2010. The greatest change in warming rate happened from approximately the period (1970-1980/1960-1970) to (1980-1990/1970-1980), so I think we still see some cherry picking, with WMO and Climate Lab Book liking different cherries. Still, no doubt it is becoming warmer…

Categories
malaria publishing

Do publisheres read articles before tweeting about them?

BioMed Central wrote this tweet twice twice the last days. They state: “Success story! Malaria burden decreases … after interventions”. Nothing wrong about the last part of the statement. In the article they see a decline in malaria cases after interventions were scaled up, but is it enough to call it a success story? I would love to see evidence malaria declining with or without interventions, and good documentation interventions are working; and I love to see the authors presenting historical data on malaria incidence, but in this case I think BioMed Central forgot it is not a newspaper, but a publisher of scientific articles.

Lets look at the figure behind the “success story”:

MalariaZimbabwe

What we see is a steady increase from 2003-2008; with IRS, and CQ+SP. After RDTs, ACT and ITNs were introduced we see a steady decline, noting that data from 2011 are not complete. Based on these data I find it hard to claim this is a success story. If we are to believe the data, the number of malaria cases is still higher than 2003-2005, and there are no evidences the recent decline was due to interventions. In my eyes, it could be due to interventions, but as likely is natural variability. The article does not test any hypothesis, and does not prove interventions caused a reduction in malaria cases, but despite this, BioMed Central calls it a “success story”. It seems like BioMed Central might have problems knowing if it is a newspaper wanting to make headlines, or a scientific publisher making evidence based statements. Malaria Journal’s coverage of the same article

makes a lot more sense, describing the article in a way which reflects the content. I hope this is a one time mistake from @BioMedCentral.